


On Friday, October 21, 2022, the weather in Auckland, New Zealand (NZ) was cloudy and the temperature was 16 degrees C. Since this winter (June-August) was the peak of the COVID-19 pandemic in NZ, Ania and her family have not traveled for a while, so Ania was planning a weekend family trip, watching the weather report: sunny and fine weather with a temperature of 20 degrees.
 |
| Fig 1: ESR COVID-19 Wastewater Surveillance Dashboard |
Friday, October 21, 2022, the weather in Auckland, New Zealand (NZ) was cloudy and the temperature was 16 degrees C. Since this winter (June-August) was the peak of the COVID-19 pandemic in NZ, Ania and her family have not traveled for a while, so Ania was planning a weekend family trip, watching the weather report: sunny and fine weather with a temperature of 20 degrees.
Ania used to like to visit Lake Taupo the most, but at this moment she had to change her plan, even the pandemic in Auckland has generally slowed down. This time, Ania consulted the Environmental Research and Science (ESR)'s COVID-19 Wastewater Surveillance Dashboard, and she changed plans for her family.
Ania, who lives in Auckland (yellow circle area in Figure 1), learned from the website that the recent pandemic has slowed down (upper right in Figure 1), but many areas are still unstable (red triangle area in Figure 1). When checking the situation in Lake Taupo, the map showed a red triangle. Ania took a closer look at the trend chart and found that although the number of confirmed cases decreased, the wastewater data showed an increase. Therefore, she changed the location and decided to go to Kawakawa Bay, where the overall pandemic situation has declined. (Figure 1 map, blue triangle area).
 |
| Fig 2: Wastewater Variant Analysis |
Not only that, but Ania had older and younger members in her family, so she further checked the situation of SARS-CoV-2 variants across the country and east of Auckland (Figure 2).
Since NZ was in a state of competition for multiple variants of the COVID-19 , the scientific uncertainty at the time was high. Therefore, it was changed to an outdoor picnic to avoid indoor dining and group gatherings, in order to reducing the unknown risks of family travel.
However, these data about COVID-19 are different from the confirmed clinical data familiar to the public (i.e. confirmed cases, hospitalization, moderate to severe disease, death, etc. in the blue curve in Figure 1), and what is this kind of "additional" environmental data?
The green curve in Figure 1 covers 73% of the NZ population, and the average number of SARS-CoV-2 genomes detected in wastewater per person per day. This is from the surveillance results of wastewater samples from lavatory, sinks and drains in households in the community. Most of these shit & poops samples are regularly collected by an automatic sampler within 24 to 25 hours for testing. After estimating the number of viruses and analyzing the variants, a weekly wastewater surveillance report is provided, and finally published on the dashboard to inform the public of potential local COVID-19 risks. Wellington Laboratory's NZ National Wastewater Surveillance for COVID-19 footprint work is like the work of a Lavatory Detective Agency.
Taking a closer look at the work of the "Lavatory Detective Agency" in NZ, it can be roughly divided into three stages (Figure 3):
 |
| Fig 3: Chronicles of New Zealand Lavatory Detective Agency for SARS-CoV-2 Footprints |
The first stage of establishment & testing:
In 2020, when the pandemic broke out in the early stage, the COVID-19 wastewater surveillance project began to be established in April.
After the alert level was raised to level 4 in May, ESR and the National Health Coordination Center (NHCC) coordinated the prevention strategy and established a national clinical data repository (Clinical Data Repository, CDR) for all COVID-19 test reports in laboratories across the country.
From July to November, closed sampling research was carried out. On the one hand, it provided a "time snapshot" of wastewater viruses, and on the other hand, it provided the theoretical basis for NZ's wastewater surveillance task.
The second phase of verification & expansion:
During the "Zero COVID" in 2021, in areas with zero confirmed cases, the evidence of the SARS-CoV-2 footprints has been detected in wastewater. In Stratford, a small town in the Taranaki (where wastewater services cover 97%) since July 2021, it has joined the COVID-19 wastewater surveillance task. For the first time, virus fragments shed after infection with SARS-CoV-2 (or SARS-CoV-2 RNA fragments) were detected in the wastewater samples.
After the wastewater "disease detective" solved the case based on the above-mentioned closed sampling research, the Detective Agency continued to strengthen public health measures, such as community testing and vaccination, canceling some community activities, and increasing wastewater sampling and testing.
Subsequently, it was found in Stratford that 6 confirmed cases were all from the same family, and the pandemic was quickly brought under control. It was not until 3 months later that further community cases were found in the wastewater, so the results of the COVID-19 wastewater surveillance tasks were verified and has been reported in the World Health Organization as a case report.
The third stage of daily wastewater surveillance:
After NZ gave up Zero COVID, it provided new digital tools for the public to "living with the COVID", allowing the exploration of the COVID-19 wastewater surveillance report to be like checking the weather report, helping the public to manage their own safety.
“NZ’s move to self-reporting has made our official case numbers less reliable than ever before – and that’s where wastewater testing comes in”, microbiologist Siouxsie Wiles and ESR geneticist Mike Bunce, the ESR scientists explained.
July 2022, NZ launched an interactive COVID-19 wastewater dashboard, using new tools to track the COVID-19 footprints, assisting the public to be ware of national and regional pandemic trends, and providing temporal and spatial visual assistance, such as map area options and searches. It also supports the comparison of trends in different time periods as shown in Figure 1 and Figure 2.
So how does NZ's "Lavatory Detective Agency" establish the relationship between wastewater data and clinical data?
It was hard to detect SARS-CoV-2 cases during the time of Zero COVID in NZ. How could NZ solve the problem of wastewater sensitivity when the virus in wastewater was extremely low? Figure 4 illustrates the overall research landscape.
 |
| Fig 4: Relations between COVID19 clinical and wastewater data |
In July 2020, ESR selected a community with a population of about 120,000 to sample wastewater daily in two areas. They are the Managed Isolation and Quarantine Facility (MIQF) and the wastewater treatment plant (WWTP).
The left side of Figure 4 is the clinical analysis of COVID-19 that is familiar to the general public, and the right side is to illustrate the analysis process of COVID-19 wastewater-based epidemiology (WBE).
The main difference between the two methods lies
in the source of samples and sampling methods.
The follow-up quality control is based on the purpose of the researcher, and different viruses are used as the control group. For example, this study chose to use Feline Infectious Peritonitis Virus (FIPV) and Murine Norovirus Virus (MNV) as external process controls to monitor viral copies and evaluate inhibition by quantitative RT-qPCR.
Subsequent processes such as virus concentration, RNA extraction, use of PCR to test whether the sample is positive or negative, or further sequencing are the same as the process of people testing the virus from nasal swabs.
Finally, using the clinical data in the EpiSurv surveillance database of the Ministry of Health, four infectious models (Total Cases, Infectious Cases: reported symptomatic cases or imputed asymptomatic cases, Relative Infectious Cases, New Daily Cases), compared with the wastewater data for statistical analysis to confirm the relationship between clinical cases and wastewater data, and verified that in a low-infection environment, wastewater data can still help to detect about 10 positive cases in an area of 100,000 people.
 |
| Fig 5: COVIDPoops19 snapshot (20230507) |
"Lavatory Detective Agency"
detects SARS-CoV-2 footprints in the environment. In the near future,
regardless of whether the next super variant is discovered, this kind of work
to track the source of potential variants will help researchers understand the
biological factors that lead to the mutation, or help ordinary people like Ania
and her family: checking the COVID-19 wastewater data is like checking the
weather data, thus self-risk prevention has become a simple daily routine. And
if scientists or digital engineers want to further use the source data of the NZ
"Lavatory Detective Agency", the "Open Lavatory" provided
by ESR is available in the open database.
Reference:
[1] https://www.health.govt.nz/covid-19-novel-coronavirus/covid-19-health-advice-public/covid-19-wastewater-testing
[2] ESR News: https://www.esr.cri.nz/home/about-esr/media-releases/streamlining-covid-19-laboratory-data-to-ministry-of-health/ ; https://www.scoop.co.nz/stories/SC2005/S00024/sysmex-and-esr-collaborate-on-national-covid-19-results-cdr.htm. 2020/5/12
[3] Hewitt, Joanne, et al. "Sensitivity of wastewater-based epidemiology for detection of SARS-CoV-2 RNA in a low prevalence setting." Water Research 211 (2022): 118032.
[4] Harvey, Helen, "The riddle in the wastewater: Taranaki 'disease detectives' solved a Covid-19 mystery", https://www.stuff.co.nz/national/health/128983961/the-riddle-in-the-wastewater-taranaki-disease-detectives-solved-a-covid19-mystery. 2022/6/18
[5] Siouxsie Wiles and Mike Bunce, "As Covid case counts become less accurate, wastewater testing is riding to the rescue", https://thespinoff.co.nz/science/13-06-2022/as-covid-case-counts-rapidly-lose-accuracy-wastewater-testing-is-riding-to-the-rescue
[6] "ESR launches interactive COVID-19 wastewater dashboard to better track the virus's progress", https://thespinoff.co.nz/science/13-06-2022/as-covid-case-counts-rapidly-lose-accuracy-wastewater-testing-is-riding-to-the-rescue
[7] COVIDPoops19: Summary of Global SARS-CoV-2 Wastewater Monitoring Efforts by UC Merced Researchers Details: https://ucmerced.maps.arcgis.com/apps/dashboards/c778145ea5bb4daeb58d31afee389082
[8] Callaway, Ewen. "These scientists traced a new coronavirus lineage to one office-through sewage." Nature News. https://www.nature.com/articles/d41586-022-02996-y. 2022/9/26
[9] ESR Open Data: https://github.com/ESR-NZ/covid_in_wastewater
SARS-CoV-2 (Q82069695): http://www.wikidata.org/entity/Q82069695
 |
| in details |

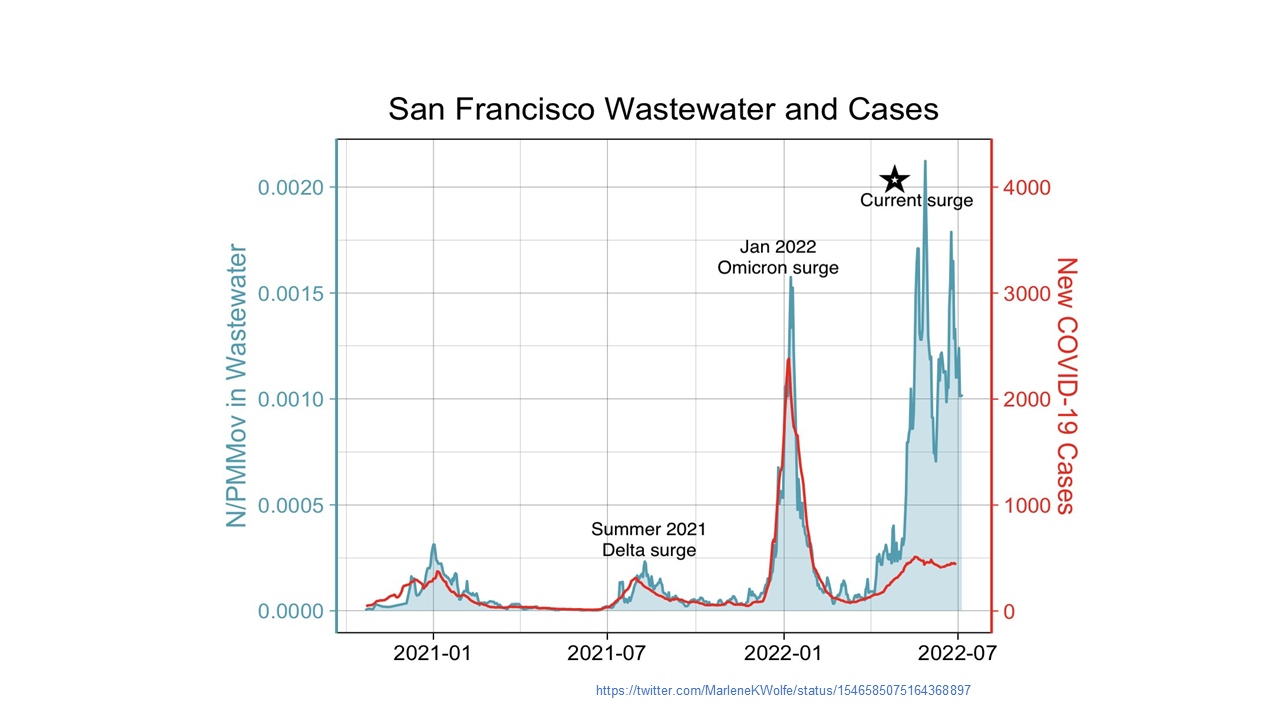
This summer, a San Francisco twitter posted a figure that shows the local COVID-19 cases were greatly underestimated.
 |
| Fig.1 |
Figure 1 shows the concentration of the SARS-CoV-2 in wastewater as dark green blocks, and publicly reported confirmed cases as red curves. Looking at the red curve would lead to the impression that the COVID-19 cases were much lower than in January, but the dark green block shows that the SARS-CoV-2 wastewater data in the San Francisco area in June and July was actually higher than in January.
At the same time, this tweet has also been echoed by twitters from all over the world, sharing Waste Water (WW) data from all over the world. Within a few hours, the Web was filled with scientific evidence of stinky shit and urine, overturning the debate on the hidden COVID-19 numbers. In fact, wastewater surveillance for the SARS-CoV-2 is not new. What is different this summer is that the public information platform is now a commonplace, providing the public with an instant understanding of the community's COVID-19 risk assessment.
 |
| Fig.2 https://biobot.io/data/ (updated 2022/10/30) |
WW profiles actually better reflect COVID-19 status than clinical PCR tests. The first known recorded case of positive RT-PCR in a poop sample was the first case in the United States at the end of January 2020 (patient day 7) [2]. The Centers for Disease Control and Prevention (CDC) launched the National Wastewater Surveillance System (NWSS) in September 2020 to coordinate wastewater surveillance programs implemented by states, tribal, local, and territorial health departments in support of the COVID-19 response. Two and a half years later, the United States has established a COVID-19 wastewater monitoring system in 46 states, 5 cities and 2 regional communities, and the samples are from wastewater systems that serve more than 130 million people in the United States [3].
As for the global context, the earliest
known result of COVID-19 wastewater surveillance is in the Netherlands in March
2020, when one or more gene fragments were detected 6 days before the first
case was reported [4].
In addition, we can know from the
CovidPoops19 project dashboard led by the University of California,
Merced, that in September 2022 the global COVID-19 wastewater monitoring
station has increased from 38 in October 2020 to 3706 now, distributed in 70
countries/ Regions, 282 academic units participation, as well as153 web-based
dashboards (Figure 3) [5]. (the moat updated numbers are in the fig 3)
 |
| Fig3. https://ucmerced.maps.arcgis.com/apps/dashboards/c778145ea5bb4daeb58d31afee389082 (updated 2022/10/30) |
SARS-CoV-2 wastewater surveillance mainly monitors shedding of SARS-CoV-2 viral fragments (genetic signals) in the feces of infected patients, whether presymptomatic, asymptomatic, or symptomatic. This waste ends up in a wastewater treatment system, where scientists can measure the number of these viral fragments in wastewater to see changes in community virus concentrations. This Environmental Surveillance (ES) method solves the so-called invisible hidden number (hidden transmission) in the face of a significant drop in COVID-19 testing or when people do not report the results of COVID-19 rapid tests at home to the health department (Figure 1. Wastewater data and clinical cases, the difference).
Sequencing wastewater to detect variants of the SARS-CoV-2 provides a better understanding of the game after the flop. For example, using RT-PCR to sequence known virus variants, or Next Generation Sequencing (NGS) sequencing of the whole genome, and then discovering unknown virus variants [6] can be used as a supplement to insufficient clinical testing, providing community answers to: Is the virus existing, absent, mutated? Concentration trends are rising or falling? etc. (Figure 2). So how did the community hidden numbers get turned out by the waste water?
First, the "public cards" ("Community Cards" in poker) are quickly turned over first. In the early stage of the pandemic, the community mostly used the strengthening of mass clinical tests to assess the coverage of the virus, but this method cost a lot of human resources and time. On the contrary, regardless of whether an individual’s trump card is covered or not (tested or not), WW data can be turned over first as a public/community card, so as to provide an overall control of the COVID-19 situation, and then in-depth prediction and prevention.
We use the seven levels of the data pyramid in Figure 4 of the WHO COVID-19 environmental surveillance document [7] to illustrate:
 |
| Fig.4 |
Only wastewater surveillance is currently discussed in the second layer of ES data, and it remains to be seen whether air samples in the future can be used to detect COVID-19 and other respiratory pathogens [8] as mature as wastewater surveillance. wastewater surveillance as a public health response approach is briefly as follows [6]:
1. Pathogens in feces (SARS-CoV-2 is shed in feces)
2. Sewage collection point (sewage flows to a centralized location, such as a sewage treatment plant)
3. Wastewater samples collected and transported to the laboratory (collected using a variety of methods depending on goals and resources)
4. Amplification of laboratory pathogen genetic material (concentration and amplification of genetic evidence RNA or DNA)
5. Pathogen and variant detection (PCR or NGS detection, quantification of pathogens)
6. Public Health Reporting (reporting findings to public health authorities to improve situational awareness and provide a scientific evidence base for action)
Evidence-based decisions are not only needed by government officials, but also by the general public. Early evidence of occult transmission is now recognized approximately 1 to 2 weeks earlier than clinically on average [1]. Figure 5(a) According to the WHO document, the early warning (including old and new variants) is about 2 weeks [7]:
 |
| Fig. 5 |
Figure 5(b) shows the COVID-19 prevention benefits of WW data at different community sizes: in community spaces with small populations such as university dormitories, naval ships, long-term care facilities, and airplanes, providing identification of early independent outbreaks; in universities, military facilities, and other population sizes In medium-sized communities, it provides notifications to allocate resources to hotspots; in metropolitan areas, it assists in large-scale outbreak surveillance.
In Taiwan, in August 2021, the surveillance stations of the SARS-CoV-2 in wastewater nationwide was expanded from 11 to 22 [8]. However, from the perspective of open science, there is no public platform for monitoring data on COVID-19 wastewater. It is like a muck that throws away the card without opening the card. Therefore, we expect that the pace of opening up Taiwan's wastewater data can keep up with the international community as soon as possible, and provide a comprehensive national COVID-19 prevention planning, community early warning, monitoring in high-risk areas such as hospitals, nursing homes, schools, or small personal travel plan evaluation information.
Is there an invisible hidden number for the COVID-19? When most people are diagnosed by RAT and have not been tested for sequencing variants, has BA.5 invaded my community? How to solve such a problem?
No more guessing, no more noisy and time-consuming and cost-intensive mass testing project, another method, COVID-19 wastewater surveillance, which is recently described by social media as shit data or poop data (poops), definitely not shit, but is instant scientific evidence that everyone submits samples to their sewer every day.
Use "wastewater sentinels" to help the community stand guard to monitor the COVID-19 and dispatch resources; see the whole picture and speculate the future trend of the epidemic in a small "crystal ball"; community sewers are like "collective intestines" that can help diagnose community conditions; Epidemic prevention without wastewater Covid-19 monitoring is "flying blindly"; and "not everyone is being tested, but everyone uses the toilet" and other recent international metaphors for Covid-19 wastewater monitoring [8], which are easy to understand and more word needed. So, is there a COVID-19 hidden number? Where are the hidden cases? The science of stinky shit and urine has the answer.
----------------------------------------------------------------------
Smelly Shit and Stinky Urine: Flip the card, a showdown with SARS-CoV-2! :
https://details-or-fragments.blogspot.com/2022/09/ww.html
----------------------------------------------------------------------
Reference:
[1] USA GAO Report, Science & Tech Spotlight: Wastewater Surveillance. GAO-22-105841 Washington, D.C.: April 11, 2022. https://www.gao.gov/products/gao-22-105841.
[2] Holshue, Michelle L., et al. "First case of 2019 novel coronavirus in the United States." New England journal of medicine (2020).
[3] US CDC, Wastewater Surveillance: A New Frontier for Public Health, https://www.cdc.gov/amd/whats-new/wastewater-surveillance.html
[4] Medema, Gertjan, et al. "Presence of SARS-Coronavirus-2 RNA in sewage and correlation withreported COVID-19 prevalence in the early stage of the epidemic in theNetherlands." Environmental Science & Technology Letters 7.7 (2020): 511-516.
[5] CovidPoops19 (Last accessed 2022/10/5) : https://ucmerced.maps.arcgis.com/apps/dashboards/c778145ea5bb4daeb58d31afee389082.
[6] Diamond, Megan B., et al. "Wastewater surveillance of pathogens can inform public healthresponses." Nature Medicine (2022): 1-4.
[7] World Health Organization. Environmental surveillance for SARS-COV-2 to complement public healthsurveillance: interim guidance, 14 April 2022. No. WHO/HEP/ECH/WSH/2022.1. World Health Organization, 2022.
[8] Related metaphors:
[9] Taiwan CDC (Last accessed 2022/10/05) : https://www.cdc.gov.tw/Bulletin/Detail/uQz0FhPiYJbyzBXNENTRYg?typeid=9