Showing posts with label wastewater data. Show all posts

2023-03-31

Whispers of Viruses and Bacteria in Wastewater

Professor Marlene Wolfe, one of the leaders of the US Sewer Coronavirus Alert Network (SCAN) team, said in an interview with the British Medical Journal: We can take that sample, which is less than a gram of wastewater solids, from communities all across the country: that small sample can represent up to 4 million people in some cases.”.

The whisper of SARS-CoV-2 was loud in less than a gram of wastewater sample. At the end of 2022, more than 3,800 monitoring stations in at least 70 countries around the world are watching the wind and listening to the whisper of SARS-CoV-2 in the water.


Figure 1: History of Wastewater Science Terminology

History of Wastewater Science Terminology

The origin of the detected wastewater can be traced back to the Broad Street cholera outbreak in Soho, London in 1854. At that time, in a public well and cesspool near a house where many people died of cholera, feces were found to leak bacteria and contaminate the water supply system of the pump, causing an epidemic. 

  • In the mid-1950s, "Wastewater Tracing or Tracking" appeared successively after the research on the wastewater infected by snail schistosomiasis in South Africa. 
  • Around 1970s, "wastewater monitoring" and "wastewater surveillance, "WWS)" or "Wastewater-Based Surveillance (WBS)" are commonly used in industrial wastewater detection research.
  • In the 2000s, issues such as tracking heroin and other illicit drugs emerged as "sewage epidemiology" and "wastewater-based epidemiology (WBE)". The mixed use of subject terms mainly describes the scientific based on the premise that the substances excreted by humans in wastewater can be used to calculate the initial concentration.

However, by 2014, the term "wastewater epidemiology" gradually replaced the term "sewage epidemiology". Although the terms sewage and wastewater are still commonly used interchangeably, the recent official documents of the World Health Organization (WHO) mainly use the term "wastewater surveillance". Scholars also suggested the standardization of related science and technology, and supported the use of "wastewater surveillance (WWS)" and "wastewater epidemiology (WBE)" as common terms.

If we examine the differences in definitions, we can distinguish them from the perspective of public health (Figure 1):

  • wastewater tracing or tracking is mainly to identify the source of pathogens or toxins;
  • wastewater monitoring is an action to ensure that waste water discharge does not cause public health risks ;
  • wastewater surveillance emphasizes systematic, continuous testing of wastewater for the benefit of public health and may be relevant for public health policy;
  • wastewater epidemiology (WBE) is the scientific field that links pathogens and chemicals found in wastewater to population health.

Which infectious human pathogens were studied in wastewater before COVID-19?

Wastewater surveillance (WWS) has been used to assess waterborne and fecal-oral pathogens that cause diarrhea-related diseases. The well-studied pathogens of human infectious diseases include picornaviridae, caliciviridae and reoviridae, etc. (indicated by * in Fig. 2). Epidemics of international concern such as coronavirus, Ebola virus, Zika fever, and polio/poliomyelitis virus (indicated by *** in Figure 2) have provided information on public health actions or policies, but influenza is rare founded in WWS literature.

Figure 2: Wastewater Surveillance (WWS) of known infectious diseases before the COVID-19 pandemic: virus classification by family/genus


If the coronavirus is the subject, the early coronavirus wastewater monitoring is in view of the emergence of new viruses with high epidemic potential, which usually involves complex dynamic effects on animals, humans and the environment. Therefore, since the 1970s, environmental monitoring has been implemented by monitoring surface water, mud and biosolids to understand the status of such viruses in the water cycle, ex. human coronavirus (HCoV), human coronavirus 229E (CoV-229E), HKU1 and severe acute respiratory syndrome coronavirus (SARS-CoV); zoonotic coronaviruses such as Middle East respiratory syndrome coronavirus (MERS-CoV) and animal coronaviruses: such as bovine coronavirus (BCoV), mouse hepatitis virus (MHV), etc. This stage focuses on coronavirus, the survival status of viruses in wastewater and the efficiency of virus recovery, etc., but the overall knowledge is still very scarce and fragmented.

After the COVID-19 pandemic

Figure 3: Overview of Wastewater Surveillance (WWS) after COVID-19

The COVID-19 pandemic has seen extensive adaptation of global wastewater surveillance (WWS), and wastewater can also be an effective potential application for surveillance of respiratory-transmitted pathogens. Technologies for detecting SARS-CoV-2 and new variants through wastewater are becoming more sophisticated. 

Figure 3 generally illustrates the current WWS in addition to early development of chemicals such as drugs, cleaning agents, industrial pollutants or pathogens like antibiotic-resistant bacteria, etc., as well as human infectious disease pathogens (described in Figure 2).

After COVID-19, in addition to the new monitoring of SARS-CoV-2, monkeypox and influenza RSV have recently become emergencies of international concern, and such pathogens have also become the focus of WWS, especially when most people cannot receive RSV clinical test, wastewater data can fill the gaps. 

Meanwhile, the progress in wastewater genome monitoring technology has solved the problem of multiple virus strains in wastewater. As shown in Figure 3, according to the WHO classification of coronavirus variant strains, new variants can be found in wastewater samples 14 days in advance, and clinical monitoring can be determined instances of virus transmission that cannot be captured, for high-risk groups such as student dormitories, airports, hospitals, nursing homes and other long-term care facilities. In addition to providing early warnings, it can also help contain and mitigate virus outbreaks. In the long run, WWS is more an important tool for tracking the dynamics of viral lineages in combination with dominance.

Further analysis from the perspective of wastewater epidemiology (WBE), in resource-rich countries is mainly assessed in sewers and sewage systems, but in resource-poor environments, most residents are not connected to centralized wastewater treatment plants, using pit toilets, septic or open defecation, so the WWS process varies depending on the wastewater system.

Overall, as shown in Figure 4, WBE includes the process of sampling, sampling methods, virus concentration and concentration techniques, use of control viruses in the control process, virus isolation, RNA extraction, virus detection and quantitative sequencing, and finally completes epidemiological modeling to analyze epidemic trends.

However, WBE still faces many challenges, such as sampling control: daily changes in water flow, differences in wastewater systems, weather factors, temperature, sedimentation rate, and virus shedding and other factors. In terms of virus recovery and concentration: concentration method efficiency, RNA extraction, purification efficiency and storage of RNA, etc. Plus virus detection and/or quantification. Challenges such as RNA quality, RNA quantity, PCR inhibitors, and normalization of data will all affect COVID-19 wastewater surveillance, which faces shortcomings such as low recovery rate and long processing time.

Figure 4: Analysis Process of COVID-19 Wastewater Epidemiology (WBE)

WWS is intended to complement, not replace clinical tests

SARS-CoV-2 wastewater surveillance differs from clinical diagnostic testing in the design and interpretation of community-scale sampling programs, as well as in the different assays which attempted to concentrate and extract RNA from wastewater and environmental water samples.

Because viral RNA can be discharged into wastewater before symptoms and diagnostic testing, SARS-CoV-2 wastewater surveillance can help document trends in high-prevalence cases of COVID-19, and in cases of low prevalence or lack of clinical testing evidence.

Early warning can be provided, while wastewater viral load can be used to monitor the impact of public health social measures, including increased or relaxed restrictions, as well as enhanced risk communication, warning the community about the (re)emergence of the virus, and advising the community about testing, quarantine, isolation, as well as suggest actions such as vaccinations and seeking health care.

In sum, WWS advantages include providing objective metrics that are less susceptible to biases inherent in clinical testings, such as 

  • health-seeking behaviour, 
  • disease severity (including symptomatic and asymptomatic), 
  • healthcare and testing accessibility, 
  • physician and individual response to testing propensity, 
  • cost and reporting constraints, etc.

We take the interactive COVID-19 WWS of the New Zealand Institute of Environmental Research and Science as an example (Figure 5). This dashboard has been launched in July 2022 to allow the public to track the footprints of SARS-CoV-2 and view national and regional epidemics, etc. latest trends.

It provides a spatial-temporal visual map; it presents wastewater statistics and provides functions such as regional options, search, and comparison of trends in different periods. 

  • From Figure 5(a), we can observe that Wellington shows that the wastewater data and the corresponding spikes of confirmed cases are different in three time periods (green dotted circles): during the peak period of the epidemic, due to sufficient clinical testing, the confirmed cases and wastewater data are about the same.
  • In the low epidemic period, the peak of wastewater data far exceeds the confirmed status due to factors such as people feeling tired (or thinking it is unnecessary) to rub their noses, the overall detection capacity slows down, or the willingness to report decreases. 
  • The public can also check the latest SARS-CoV-2 variant virus. Figure 5 (b) and (c) show the ratio and trend information respectively.

In general, the wastewater data not only supplements clinical monitoring, but also provides background information on the public’s epidemic prevention environment base. The dashboard shows that wastewater data covers 73% of the population in New Zealand. A small sample of less than one gram only needs a few expensive PCRs.

Compared with the costs of tests and costs for clinical PCR, yes, using WWS to listen to the muttering sounds from all directions in the wastewater is cheaper and wider. Plus, virus and bacteria of various kinds can be identified, warned and tracked broadly. It can also assist the public in preventing and managing risks by them selves, easily in their daily life and sustainably for the whole country health.

Figure 5:SARS-CoV-2 wastewater monitoring network of the Institute of Environmental Science and Research (ESR) in New Zealand
COVID-19 Wastewater Surveillance Dashboard: https://esr-cri.shinyapps.io/wastewater


Reference

[1] Nelson, Bryn. What poo tells us: wastewater surveillance comes of age amid covid, monkeypox, and polio. BMJ 378 (2022).

[2] COVIDPoops19: https://ucmerced.maps.arcgis.com/apps/dashboards/c778145ea5bb4daeb58d31afee389082

[3] Kilaru P, Hill D, Anderson K, Collins MB, Green H, Kmush BL, Larsen DA. Wastewater Surveillance for Infectious Disease: A Systematic Review. Am J Epidemiol. (2022) Oct 13.

[4] Larsen, David A., et al. Wastewater monitoring, surveillance and epidemiology: a review of terminology for a common understanding. FEMS microbes 2 (2022). 2021-08-19

[5] Gonçalves, José, et al. Centralized and decentralized wastewater-based epidemiology to infer COVID-19 transmission–A brief review. One Health (2022): 100405.

[6] World Health Organization. Environmental surveillance for SARS-COV-2 to complement public health surveillance: interim guidance, 14 April 2022. No. WHO/HEP/ECH/WSH/2022.1. WHO (2022).

[7] [3]

[8] Carducci, Annalaura, et al. Making waves: coronavirus detection, presence and persistence in the water environment: state of the art and knowledge needs for public health. Water Research 179 (2020): 115907.

[9] McPhillips, D and Howard,J (CNN), The RSV surge didnt come out of nowhere, but gaps in data made it tougher to predict, October 27, 2022. https://edition.cnn.com/2022/10/27/health/virus-surveillance-data-gaps/index.html

[10] Karthikeyan, Smruthi, et al. Wastewater sequencing reveals early cryptic SARS-CoV-2 variant transmission. Nature 609.7925 (2022): 101-108.

[11] Aguiar-Oliveira, Maria de Lourdes, et al. Wastewater-based epidemiology (WBE) and viral detection in polluted surface water: A valuable tool for COVID-19 surveillance—A brief review. International journal of environmental research and public health 17.24 (2020): 9251.

[12] [6] 


medium URI: https://medium.com/@andreahuang2019/whispers-of-viruses-and-bacteria-in-wastewater-95a7776a31b3


2022-11-03

metaRead: How to Solve the Covid Testing Data Problem | 如何解決新冠檢測資料問題

How to Solve the Covid Testing Data Problem By Faye Flam at  
https://www.bloomberg.com/opinion/articles/2022-10-29/covid-wastewater-data-is-the-best-way-to-track-the-virus-this-winter | 彭博社論 (2022-10-29)

  • Many people are no longer taking PCR or rapid tests — even when they have symptoms. Better wastewater data can help.
  • 許多人不再接受 PCR 或 快篩——即使他們有症狀。更好的廢水資料可以提供幫助。

 Opinions include | 引用觀點來源包括:

Key points | 重要觀點:

  •  " ... as testing dropped off, the wastewater measurements separated — showing new hills that weren’t visible from official testing data" | 隨著新冠檢測的減少,廢水測量結果——顯示了官方檢測資料中看不到的新山丘。
  • "... biologists tracking the Covid pandemic forecast a long purgatory..." | 追踪新冠大流行的生物學家預測,一場漫長的煉獄將到來。
  • "It would also be a public health service to make sure that the data is presented simply and clearly, so that people can check it as effortlessly as they do the weather forecast. And just as with the weather, regular “Covid forecasts” should be featured on the local news — especially when a disaster is on the way." | 這也將是一項公共衛生服務,以確保資料的呈現簡單明了,以便人們可以像查看天氣預報一樣輕鬆查看資料。就像天氣一樣,定期的“新冠病毒預報”應該出現在當地新聞中——尤其是在災難即將來臨的時候。
 
COVID-19 rapid antigen testCOVID-19抗原快篩http://www.wikidata.org/entity/Q106915773
Covid-19 Testing 新冠檢測http://www.wikidata.org/entity/Q86901049
pandemic大流行http://www.wikidata.org/entity/Q12184
PCR TestPCR 檢測http://www.wikidata.org/entity/Q176996
public health公共衛生http://www.wikidata.org/entity/Q189603
sewage污水http://www.wikidata.org/entity/Q10966166
wastewater 廢水http://www.wikidata.org/entity/Q336191
wastewater monitoring廢水偵測http://www.wikidata.org/entity/Q95586549
wastewater surveillance 廢水監測http://www.wikidata.org/entity/Q98073976


2022-09-27

Smelly Shit and Stinky Urine: Flip the card, a showdown with SARS-CoV-2!

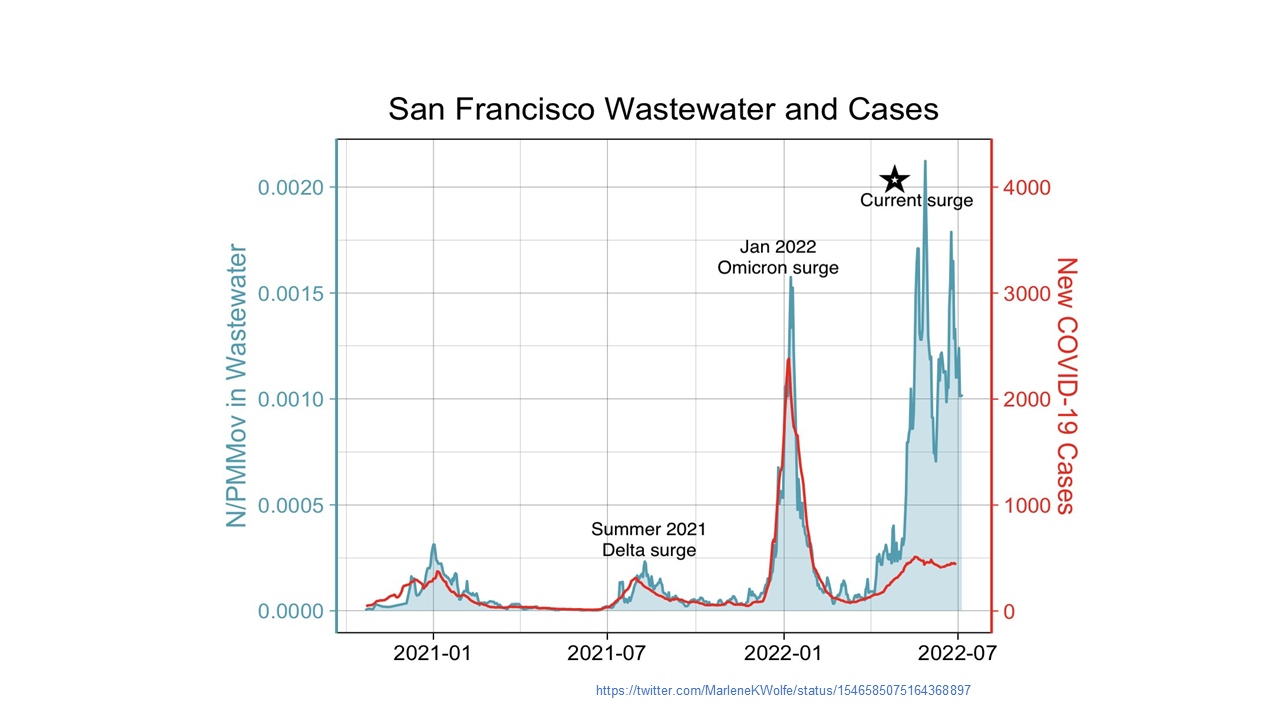
This summer, a San Francisco twitter posted a figure that shows the local COVID-19 cases were greatly underestimated.

Fig.1

Figure 1 shows the concentration of the SARS-CoV-2 in wastewater as dark green blocks, and publicly reported confirmed cases as red curves. Looking at the red curve would lead to the impression that the COVID-19 cases were much lower than in January, but the dark green block shows that the SARS-CoV-2 wastewater data in the San Francisco area in June and July was actually higher than in January. 

At the same time, this tweet has also been echoed by twitters from all over the world, sharing Waste Water (WW) data from all over the world. Within a few hours, the Web was filled with scientific evidence of stinky shit and urine, overturning the debate on the hidden COVID-19 numbers. In fact, wastewater surveillance for the SARS-CoV-2 is not new. What is different this summer is that the public information platform is now a commonplace, providing the public with an instant understanding of the community's COVID-19 risk assessment.

Fig.2 https://biobot.io/data/ (updated 2022/10/30)
Another feature of this summer's WW data is the variant data. Taking the United States as an example (Figure 2), through the open data platform, the wastewater treatment biological robot website publishes the wastewater data of each state as a leading indicator, and discloses the coverage of the latest variants in each region, providing the public as a basis for risk communication. In the past, most people mainly relied on confirmed cases to build their perception of risk. On the other hand, there have been repeated COVID-19 hidden numbers such as: asymptomatic, test speed, or Reverse Transcription-Polymerase Chain Reaction (RT-PCR) caused by problems such as insufficient testing capacities is seriously underestimated. Studies indicate that individuals with SARS-CoV-2 detected from asymptomatic individuals for approximately 70% of cases, and these cases are often one of the hidden numbers who do not seek clinical testing [1].

WW profiles actually better reflect COVID-19 status than clinical PCR tests. The first known recorded case of positive RT-PCR in a poop sample was the first case in the United States at the end of January 2020 (patient day 7) [2]. The Centers for Disease Control and Prevention (CDC) launched the National Wastewater Surveillance System (NWSS) in September 2020 to coordinate wastewater surveillance programs implemented by states, tribal, local, and territorial health departments in support of the COVID-19 response. Two and a half years later, the United States has established a COVID-19 wastewater monitoring system in 46 states, 5 cities and 2 regional communities, and the samples are from wastewater systems that serve more than 130 million people in the United States [3].

As for the global context, the earliest known result of COVID-19 wastewater surveillance is in the Netherlands in March 2020, when one or more gene fragments were detected 6 days before the first case was reported [4]. In addition, we can know from the CovidPoops19 project dashboard led by the University of California, Merced, that in September 2022 the global COVID-19 wastewater monitoring station has increased from 38 in October 2020 to 3706 now, distributed in 70 countries/ Regions, 282 academic units participation, as well as153 web-based dashboards (Figure 3) [5]. (the moat updated numbers are in the fig 3)

Fig3. https://ucmerced.maps.arcgis.com/apps/dashboards/c778145ea5bb4daeb58d31afee389082 (updated 2022/10/30)

SARS-CoV-2  wastewater surveillance mainly monitors shedding of SARS-CoV-2 viral fragments (genetic signals) in the feces of infected patients, whether presymptomatic, asymptomatic, or symptomatic. This waste ends up in a wastewater treatment system, where scientists can measure the number of these viral fragments in wastewater to see changes in community virus concentrations. This Environmental Surveillance (ES) method solves the so-called invisible hidden number (hidden transmission) in the face of a significant drop in COVID-19 testing or when people do not report the results of COVID-19 rapid tests at home to the health department (Figure 1. Wastewater data and clinical cases, the difference).

Sequencing wastewater to detect variants of the SARS-CoV-2 provides a better understanding of the game after the flop. For example, using RT-PCR to sequence known virus variants, or Next Generation Sequencing (NGS) sequencing of the whole genome, and then discovering unknown virus variants [6] can be used as a supplement to insufficient clinical testing, providing community answers to: Is the virus existing, absent, mutated? Concentration trends are rising or falling? etc. (Figure 2). So how did the community hidden numbers get turned out by the waste water?

First, the "public cards" ("Community Cards" in poker) are quickly turned over first. In the early stage of the pandemic, the community mostly used the strengthening of mass clinical tests to assess the coverage of the virus, but this method cost a lot of human resources and time. On the contrary, regardless of whether an individual’s trump card is covered or not (tested or not), WW data can be turned over first as a public/community card, so as to provide an overall control of the COVID-19 situation, and then in-depth prediction and prevention.

We use the seven levels of the data pyramid in Figure 4 of the WHO COVID-19 environmental surveillance document [7] to illustrate:

Fig.4

  • the bottom layer is all viruses that are infected with the COVID-19 excreted into the environment, and 
  • the second layer is environmental surveillance data (ES data), including pre-symptomatic, Symptomatic or asymptomatic WW profiles. 
  • the third and fourth layers are clinical tests that are familiar to the public, such as RAT, PCR detection of antigens and antibodies, or diagnosis and judgment by medical personnel when testing resources are lacking; 
  • the last top three layers are hospitalization data, including hospitalization, severe illness and death, which are mainly monitored and reported by the medical system.

Only wastewater surveillance is currently discussed in the second layer of ES data, and it remains to be seen whether air samples in the future can be used to detect COVID-19 and other respiratory pathogens [8] as mature as wastewater surveillance. wastewater surveillance as a public health response approach is briefly as follows [6]:

1. Pathogens in feces (SARS-CoV-2 is shed in feces)

2. Sewage collection point (sewage flows to a centralized location, such as a sewage treatment plant)

3. Wastewater samples collected and transported to the laboratory (collected using a variety of methods depending on goals and resources)

4. Amplification of laboratory pathogen genetic material (concentration and amplification of genetic evidence RNA or DNA)

5. Pathogen and variant detection (PCR or NGS detection, quantification of pathogens)

6. Public Health Reporting (reporting findings to public health authorities to improve situational awareness and provide a scientific evidence base for action)

Evidence-based decisions are not only needed by government officials, but also by the general public. Early evidence of occult transmission is now recognized approximately 1 to 2 weeks earlier than clinically on average [1]. Figure 5(a) According to the WHO document, the early warning (including old and new variants) is about 2 weeks [7]:

Fig. 5

  • Take action in Week 1 to encourage community testing,
  • Predicted cases in the second week, peak hospitalization after 3 weeks of medical preparation,
  • Implement interventions to reduce transmission before peak cases in week 5. 
  • Finally, lower the restriction measures according to the proportion of the data.

Figure 5(b) shows the COVID-19 prevention benefits of WW data at different community sizes: in community spaces with small populations such as university dormitories, naval ships, long-term care facilities, and airplanes, providing identification of early independent outbreaks; in universities, military facilities, and other population sizes In medium-sized communities, it provides notifications to allocate resources to hotspots; in metropolitan areas, it assists in large-scale outbreak surveillance.

In Taiwan, in August 2021, the surveillance stations of the SARS-CoV-2 in wastewater nationwide was expanded from 11 to 22 [8]. However, from the perspective of open science, there is no public platform for monitoring data on COVID-19 wastewater. It is like a muck that throws away the card without opening the card. Therefore, we expect that the pace of opening up Taiwan's wastewater data can keep up with the international community as soon as possible, and provide a comprehensive national COVID-19 prevention planning, community early warning, monitoring in high-risk areas such as hospitals, nursing homes, schools, or small personal travel plan evaluation information.

Is there an invisible hidden number for the COVID-19? When most people are diagnosed by RAT and have not been tested for sequencing variants, has BA.5 invaded my community? How to solve such a problem?

No more guessing, no more noisy and time-consuming and cost-intensive mass testing project, another method, COVID-19 wastewater surveillance, which is recently described by social media as shit data or poop data (poops), definitely not shit, but is instant scientific evidence that everyone submits samples to their sewer every day.

Use "wastewater sentinels" to help the community stand guard to monitor the COVID-19 and dispatch resources; see the whole picture and speculate the future trend of the epidemic in a small "crystal ball"; community sewers are like "collective intestines" that can help diagnose community conditions; Epidemic prevention without wastewater Covid-19 monitoring is "flying blindly"; and "not everyone is being tested, but everyone uses the toilet" and other recent international metaphors for Covid-19 wastewater monitoring [8], which are easy to understand and more word needed. So, is there a COVID-19 hidden number? Where are the hidden cases? The science of stinky shit and urine has the answer.

----------------------------------------------------------------------

Smelly Shit and Stinky Urine: Flip the card, a showdown with SARS-CoV-2! :

https://details-or-fragments.blogspot.com/2022/09/ww.html

----------------------------------------------------------------------

Reference:

[1] USA GAO Report, Science & Tech Spotlight: Wastewater Surveillance. GAO-22-105841 Washington, D.C.: April 11, 2022. https://www.gao.gov/products/gao-22-105841.

[2] Holshue, Michelle L., et al. "First case of 2019 novel coronavirus in the United States." New England journal of medicine (2020).

[3] US CDC, Wastewater Surveillance: A New Frontier for Public Health, https://www.cdc.gov/amd/whats-new/wastewater-surveillance.html

[4] Medema, Gertjan, et al. "Presence of SARS-Coronavirus-2 RNA in sewage and correlation withreported COVID-19 prevalence in the early stage of the epidemic in theNetherlands." Environmental Science & Technology Letters 7.7 (2020): 511-516.

[5] CovidPoops19 (Last accessed 2022/10/5) : https://ucmerced.maps.arcgis.com/apps/dashboards/c778145ea5bb4daeb58d31afee389082.

[6] Diamond, Megan B., et al. "Wastewater surveillance of pathogens can inform public healthresponses." Nature Medicine (2022): 1-4.

[7] World Health Organization. Environmental surveillance for SARS-COV-2 to complement public healthsurveillance: interim guidance, 14 April 2022. No. WHO/HEP/ECH/WSH/2022.1. World Health Organization, 2022.

[8] Related metaphors:

[9] Taiwan CDC (Last accessed 2022/10/05) : https://www.cdc.gov.tw/Bulletin/Detail/uQz0FhPiYJbyzBXNENTRYg?typeid=9